Before the days of AWR, there was something called Statspack (and before that, bstat/estat (and before that, dirt and a stick)). There was a lot of good information in Statspack reports, but you still needed to be aware of Oracle tuning principles, how to read it, how NOT to read it, and what else to look for.
Even with great tools now like AWR, ASH, etc. you need to be knowledgable of Oracle tuning principles and have some tuning savvy. It comes with experience and having mentor resources. I’ve seen sad situations where folks are contracted in and asked to perform some tuning/capacity/forecasting analysis and have turned in reports that were jokes. Just because “Oracle” is on their resume make them not an Oracle tuning expert be (even if they can write English good).
As quick as I’d like to call myself superior in tuning matters, inevitably something will happen that will make me feel inferior. So while I learn to be patient in my inferiority, I try to come up with tools to help me cut to the chase when working through tuning tasks.
BUILDING A SQL “HIT LIST” FROM STATSPACK DATA
No, I’m not a fan of “The Sopranos” nor have I ever seen the show (I like comedies … Simpsons, Family Guy, etc). The “hit list” is a simple “Top 10” type list of the heaviest SQL. It’s more like a pivoted version of the “Top Gets”/”Top Physical Reads” sections at the end of the Statspack report.
The screen cap below shows some of the data I collect and aggregate. This is sorted by descending Statspack snapshot date and then by descending Score, the latter column being a metric I concocted. The GPE, CPE, and EPE columns are “Gets per Execution”, “CPU per Execution”, and “Elapsed Time per Execution” respectively.
Click pic to enlarge …
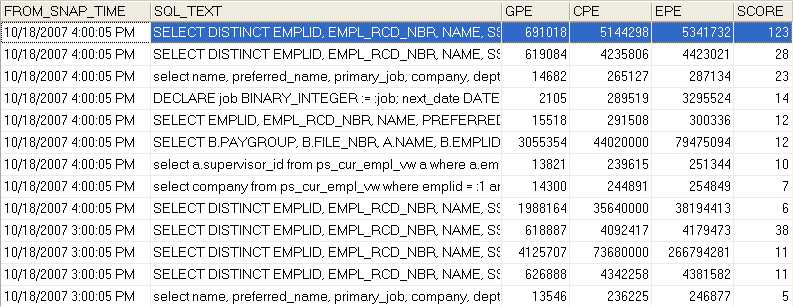
The algorithm for my Score column is [% Rank of this SQL amongst all SQL in Gets per Execution]+[% Rank of this SQL amongst all SQL in CPU per Execution]+[% Rank of this SQL amongst all SQL in Elapsed Time per Execution]+[% Rank of this SQL amongst all SQL in Gets]+[% Rank of this SQL amongst all SQL in CPU]+[% Rank of this SQL amongst all SQL in Elapsed Time]. Yeah, that’s a mouthful, but the reason I use this algorithm for scoring is so I can look to see in one fell swoop not only what SQL is by itself heavy, but what SQL that is executed repeatedly is cumulatively heavy. For the latter, there is a likely need to dig into what code is calling this sql as perhaps both code and sql need to be tuned.
Gets (Buffer Gets), CPU, and Elapsed Time are probably the 3 biggest key performance metrics for SQL. However, since everyone’s performance footprint is different, whatever Score algorithm works for me may not work for someone else.
To that end, I’ve included the package code (PerfExt, for Perfstat
Extension) below that creates this Hit List, as well as supporting tables for it, for those who might want to dig into this concept and want to customize for their need. The entry point to this package is “refreshall”, with the main programs “refresh” and “create_sql_summary”.
Key logic flow outline for the “refresh” and “create_sql_summary” procs:
1. Takes in one mandatory parameter, snap_id (a PERFSTAT primary key column for a snapshot). An optional boolean argument can be passed to “refresh” to force a refresh of PerfExt data for that snapshot.
2. If data for this snapshot already exists, do not take action (unless force option is enabled), otherwise get previous snap_id and snap_time and call “create_sql_summary” to collect all sql collected in this snapshot and aggregate metrics for PerfExt tables.
3. For every SQL statement, retrieve metrics for the previous snapshot and take their deltas. If delta is negative, just use the current metric (I can only guess metrics “rotate” as SQL comes in and out of SGA). Store the cumulatives and deltas in separate tables (as it can come in handy). Also keep a running tally of “per execution” metrics.
4. Keep track of all SQL statements and their delta metrics in an array, and tally a running total for all SQL of the same metrics.
5. After looping through all the SQL, store those running totals (cumulatives, deltas, per executions) into a separate aggregate tables (again, handy).
6. Now build the Hit List table. This is the likely place where you would want to customize, as this only picks out certain SQL you want to capture on your Hit List. For my purposes, the criteria for inclusion is one or more of the following:
a. SQL whose Buffer Gets account for at least 1% of the total SQL workload (G_PCT).
b. Same where CPU is at least 10% of the total (C_PCT).
c. Same where Elapsed Time is at least 10% of the total (E_PCT).
d. Same where Gets Per Execution is at least 1% of the total (GPE_PCT).
e. Same where CPU Per Execution is at least 10% of the total (CPE_PCT).
f. Same where Elapsed Time Per Execution is at least 10% of the total (EPE_PCT).
I’ve built this in my Oracle 10g databases as well to supplement AWR. The nice thing is that I could eliminate all the delta processing, since Oracle blessed us with including delta columns in the AWR tables.
Final thought: This is not the end-all-be-all solution for Oracle tuning. SQL performance metrics is one piece of a much bigger pie. There’s also session waits, code that calls sql, instance params, RAC matters (if running RAC), underlying hardware, underlying OS, networking, etc. I could write mountains of paper on the subject, but certainly others who have done this longer and better than me already have (Burleson, Niemic, Shallahamer, to name a few). Seek ’em out. But if I ever write a book, please buy mine too.
Learning to be patient,
Walt Silva
CREATE OR REPLACE package body PERFSTAT.perfext as
—
— USUAL DISCLAIMER:
— USE CODE AT YOUR OWN RISK
— DO NOT USE IN PRODUCTION WITHOUT TESTING FIRST
— BLAH, BLAH, BLAH
—
——————————————————————–
gDebug boolean:=false;
gDebugRefresh boolean:=false;
gSnapTime date;
gPrevSnapTime date;
gPrevSnapID number;
gFakeNoData boolean:=false;
type sql_summary_rec_type is record
(
address varchar2(50)
,hash_value number
,sorts number
,FETCHES number
,EXECUTIONS number
,PARSE_CALLS number
,DISK_READS number
,BUFFER_GETS number
,ROWS_PROCESSED number
,CPU_TIME number
,ELAPSED_TIME number
);
type sql_summary_table_type is table of sql_summary_rec_type index by varchar2(100);
——————————————————————–
procedure refresh(in_snap_id number, in_force boolean default false); function perfext_data_exists(in_snap_id number) return boolean;
procedure create_sql_summary(in_snap_id number);
——————————————————————–
function get_sqltext(in_address raw, in_hash_value number, in_length number default 1000) return varchar2
is
cursor c1 (p_address raw, p_hash_value number) is
select sql_text
from perfstat.stats$sqltext
where 1=1
and address=p_address
and hash_value=p_hash_value
order by piece ;
bHit boolean:=false;
ctr number:=0;
vSQL varchar2(32767):=”;
vMax number:=32767;
vAddress raw(8);
begin
begin
begin
select address
into vAddress
from perfstat.stats$sqltext
where address=in_address
and hash_value=in_hash_value;
exception when others
then
select max(address)
into vAddress
from perfstat.stats$sqltext
where hash_value=in_hash_value;
end;
if in_length<vMax then vMax:=in_length; end if;
for v1 in c1 (vAddress, in_hash_value)
loop
bHit:=true;
ctr:=ctr+length(v1.sql_text);
if ctr>=vMax then goto the_end; end if;
vSQL:=vSQL||v1.sql_text;
end loop;
<<the_end>>
null;
exception when others then null;
end;
return vSQL;
end;
——————————————————————–
procedure purgedata(in_snap_id number)
is
begin
delete from perfstat.perfext_sql_summary where snap_id=in_snap_id;
delete from perfstat.perfext_sql_summary_agg where snap_id=in_snap_id;
delete from perfstat.perfext_sql_summary_aggpe where snap_id=in_snap_id;
delete from perfstat.perfext_sql_summary_delta where snap_id=in_snap_id;
delete from perfstat.perfext_sql_summary_agg_delta where snap_id=in_snap_id;
delete from perfstat.perfext_sql_hitlist where snap_id=in_snap_id;
commit;
end;
——————————————————————–
procedure purge
is
cursor c1
is
select snap_id
from perfstat.perfext_sql_summary_agg a
where not exists
(
select ‘x’
from perfstat.stats$snapshot b
where b.snap_id=a.snap_id
)
;
bDataExists boolean;
begin
for v1 in c1
loop
purgedata(v1.snap_id);
end loop;
end;
——————————————————————–
procedure refreshall(in_force boolean default false)
is
cursor c1
is
select snap_id
from perfstat.stats$snapshot
;
begin
if gDebug
then
if in_force
then
dbms_output.put_line(‘Refresh all,Force=Y’);
else
dbms_output.put_line(‘Refresh all,Force=N’);
end if;
end if;
for v1 in c1
loop
refresh(v1.snap_id,in_force);
end loop;
end;
——————————————————————–
procedure refresh(in_snap_id number, in_force boolean default false)
is
bDataExists boolean;
bRefresh boolean:=false;
begin
if gDebug
then
if in_force
then
dbms_output.put_line(‘Refresh ‘||in_snap_id||’,Force=Y’);
else
dbms_output.put_line(‘Refresh ‘||in_snap_id||’,Force=N’);
end if;
end if;
if in_force
then
purgedata(in_snap_id);
bRefresh:=true;
else
if gDebug then dbms_output.put_line(‘…Checking if data exists’); end if;
bDataExists:=perfext_data_exists(in_snap_id);
if gDebug
then
if bDataExists
then
dbms_output.put_line(‘…Data exists’);
else
dbms_output.put_line(‘…Data DOES NOT EXIST’);
end if;
end if;
if not bDataExists
then
bRefresh:=true;
end if;
end if;
if bRefresh
then
if gDebugRefresh then dbms_output.put_line(‘Refreshing ‘||in_snap_id); end if;
select snap_time into gSnapTime from perfstat.stats$snapshot where snap_id=in_snap_id;
gPrevSnapTime:=null;
gPrevSnapID:=null;
begin
select max(snap_id) into gPrevSnapID from perfstat.stats$snapshot where snap_id<in_snap_id;
select snap_time into gPrevSnapTime from perfstat.stats$snapshot where snap_id=gPrevSnapID;
exception when others then null;
end;
create_sql_summary(in_snap_id);
commit;
end if;
end;
——————————————————————–
procedure create_sql_summary(in_snap_id number)
is
cursor c1 is
select /*+rule*/
a.ADDRESS
,a.HASH_VALUE
,sum(a.SORTS) sorts
,sum(a.FETCHES) FETCHES
,sum(a.EXECUTIONS) EXECUTIONS
,sum(a.PARSE_CALLS) PARSE_CALLS
,sum(a.DISK_READS) DISK_READS
,sum(a.BUFFER_GETS) BUFFER_GETS
,sum(a.ROWS_PROCESSED) ROWS_PROCESSED
,sum(a.CPU_TIME) CPU_TIME
,sum(a.ELAPSED_TIME) ELAPSED_TIME
,count(1) rowcount
— ,sum(a.ELAPSED_TIME)/decode(sum(a.executions),0,1,sum(a.executions)) epe
— ,sum(a.cpu_TIME)/decode(sum(a.executions),0,1,sum(a.executions)) cpe
— ,sum(a.buffer_gets)/decode(sum(a.executions),0,1,sum(a.executions)) gpe
from
perfstat.stats$sql_summary a
,perfstat.stats$snapshot b
where 1=1
and a.snap_id=in_snap_id
and b.snap_id=in_snap_id
group by a.address,a.hash_value
;
vsorts number:=0;
vFETCHES number:=0;
vEXECUTIONS number:=0;
vPARSE_CALLS number:=0;
vDISK_READS number:=0;
vBUFFER_GETS number:=0;
vROWS_PROCESSED number:=0;
vCPU_TIME number:=0;
vELAPSED_TIME number:=0;
vPrevSorts number:=0;
vPrevFETCHES number:=0;
vPrevEXECUTIONS number:=0;
vPrevPARSE_CALLS number:=0;
vPrevDISK_READS number:=0;
vPrevBUFFER_GETS number:=0;
vPrevROWS_PROCESSED number:=0;
vPrevCPU_TIME number:=0;
vPrevELAPSED_TIME number:=0;
vDeltaSorts number:=0;
vDeltaFETCHES number:=0;
vDeltaEXECUTIONS number:=0;
vDeltaPARSE_CALLS number:=0;
vDeltaDISK_READS number:=0;
vDeltaBUFFER_GETS number:=0;
vDeltaROWS_PROCESSED number:=0;
vDeltaCPU_TIME number:=0;
vDeltaELAPSED_TIME number:=0;
vTotDeltaSorts number:=0;
vTotDeltaFETCHES number:=0;
vTotDeltaEXECUTIONS number:=0;
vTotDeltaPARSE_CALLS number:=0;
vTotDeltaDISK_READS number:=0;
vTotDeltaBUFFER_GETS number:=0;
vTotDeltaROWS_PROCESSED number:=0;
vTotDeltaCPU_TIME number:=0;
vTotDeltaELAPSED_TIME number:=0;
vRows number:=0;
vtot_sorts_per_exec number:=0;
vtot_fetches_per_exec number:=0;
vtot_parse_calls_per_exec number:=0;
vtot_disk_reads_per_exec number:=0;
vtot_buffer_gets_per_exec number:=0; vtot_rows_processed_per_exec number:=0; vtot_cpu_time_per_exec number:=0; vtot_elapsed_time_per_exec number:=0; vPrevSnapTime date; tSQLSummary sql_summary_table_type; vKey varchar2(50); vSQLText varchar2(2000); vScore number; begin
for v1 in c1
loop
vRows:=vRows+1;
vsorts:=vsorts+v1.SORTS;
vFETCHES:=vFETCHES+v1.FETCHES;
vEXECUTIONS:=vEXECUTIONS+v1.EXECUTIONS;
vPARSE_CALLS:=vPARSE_CALLS+v1.PARSE_CALLS;
vDISK_READS:=vDISK_READS+v1.DISK_READS;
vBUFFER_GETS:=vBUFFER_GETS+v1.BUFFER_GETS;
vROWS_PROCESSED:=vROWS_PROCESSED+v1.ROWS_PROCESSED;
vCPU_TIME:=vCPU_TIME+v1.CPU_TIME;
vELAPSED_TIME:=vELAPSED_TIME+v1.ELAPSED_TIME;
if v1.executions>0
then
vtot_sorts_per_exec:=vtot_sorts_per_exec+(v1.sorts/v1.executions);
vtot_fetches_per_exec:=vtot_fetches_per_exec+(v1.fetches/v1.executions);
vtot_parse_calls_per_exec:=vtot_parse_calls_per_exec+(v1.parse_calls/v1.exec
utions);
vtot_disk_reads_per_exec:=vtot_disk_reads_per_exec+(v1.disk_reads/v1.executi
ons);
vtot_buffer_gets_per_exec:=vtot_buffer_gets_per_exec+(v1.buffer_gets/v1.exec
utions);
vtot_rows_processed_per_exec:=vtot_rows_processed_per_exec+(v1.rows_processe
d/v1.executions);
vtot_cpu_time_per_exec:=vtot_cpu_time_per_exec+(v1.cpu_time/v1.executions);
vtot_elapsed_time_per_exec:=vtot_elapsed_time_per_exec+(v1.elapsed_time/v1.e
xecutions);
end if;
begin
select
a.SORTS
,a.FETCHES
,a.EXECUTIONS
,a.PARSE_CALLS
,a.DISK_READS
,a.BUFFER_GETS
,a.ROWS_PROCESSED
,a.CPU_TIME
,a.ELAPSED_TIME
into
vPrevSORTS
,vPrevFETCHES
,vPrevEXECUTIONS
,vPrevPARSE_CALLS
,vPrevDISK_READS
,vPrevBUFFER_GETS
,vPrevROWS_PROCESSED
,vPrevCPU_TIME
,vPrevELAPSED_TIME
from perfstat.perfext_sql_summary a
where a.snap_id=gPrevSnapID
and a.ADDRESS=v1.address
and a.HASH_VALUE=v1.hash_value
;
if vPrevSORTS<=v1.SORTS
then
vDeltaSorts:=v1.SORTS- vPrevSORTS ;
else
vDeltaSorts:=v1.SORTS;
end if;
if vPrevFETCHES<=v1.FETCHES
then
vDeltaFETCHES:=v1.FETCHES- vPrevFETCHES;
else
vDeltaFETCHES:=v1.FETCHES;
end if;
if vPrevEXECUTIONS<=v1.EXECUTIONS
then
vDeltaEXECUTIONS:=v1.EXECUTIONS- vPrevEXECUTIONS;
else
vDeltaEXECUTIONS:=v1.EXECUTIONS;
end if;
if vPrevPARSE_CALLS<=v1.PARSE_CALLS
then
vDeltaPARSE_CALLS:=v1.PARSE_CALLS- vPrevPARSE_CALLS;
else
vDeltaPARSE_CALLS:=v1.PARSE_CALLS;
end if;
if vPrevDISK_READS<=v1.DISK_READS
then
vDeltaDISK_READS:=v1.DISK_READS- vPrevDISK_READS;
else
vDeltaDISK_READS:=v1.DISK_READS;
end if;
if vPrevBUFFER_GETS<=v1.BUFFER_GETS
then
vDeltaBUFFER_GETS:=v1.BUFFER_GETS-vPrevBUFFER_GETS;
else
vDeltaBUFFER_GETS:=v1.BUFFER_GETS;
end if;
if vPrevROWS_PROCESSED<=v1.ROWS_PROCESSED
then
vDeltaROWS_PROCESSED:=v1.ROWS_PROCESSED-vPrevROWS_PROCESSED;
else
vDeltaROWS_PROCESSED:=v1.ROWS_PROCESSED;
end if;
if vPrevCPU_TIME<=v1.CPU_TIME
then
vDeltaCPU_TIME:=v1.CPU_TIME-vPrevCPU_TIME;
else
vDeltaCPU_TIME:=v1.CPU_TIME;
end if;
if vPrevELAPSED_TIME<=v1.ELAPSED_TIME
then
vDeltaELAPSED_TIME:=v1.ELAPSED_TIME-vPrevELAPSED_TIME;
else
vDeltaELAPSED_TIME:=v1.ELAPSED_TIME;
end if;
vPrevSnapTime:=gPrevSnapTime;
exception when others
then
vDeltaSorts:=v1.SORTS;
vDeltaFETCHES:=v1.FETCHES;
vDeltaEXECUTIONS:=v1.EXECUTIONS;
vDeltaPARSE_CALLS:=v1.PARSE_CALLS;
vDeltaDISK_READS:=v1.DISK_READS;
vDeltaBUFFER_GETS:=v1.BUFFER_GETS;
vDeltaROWS_PROCESSED:=v1.ROWS_PROCESSED;
vDeltaCPU_TIME:=v1.CPU_TIME;
vDeltaELAPSED_TIME:=v1.ELAPSED_TIME;
vPrevSnapTime:=null;
end;
insert into perfstat.perfext_sql_summary_delta
(
FROM_SNAP_TIME
,SNAP_ID
,TO_SNAP_TIME
,ADDRESS
,HASH_VALUE
,SORTS
,FETCHES
,EXECUTIONS
,PARSE_CALLS
,DISK_READS
,BUFFER_GETS
,ROWS_PROCESSED
,CPU_TIME
,ELAPSED_TIME
)
values
(
vPrevSnapTime
,in_snap_id
,gSnapTime
,v1.ADDRESS
,v1.HASH_VALUE
,vDeltaSORTS
,vDeltaFETCHES
,vDeltaEXECUTIONS
,vDeltaPARSE_CALLS
,vDeltaDISK_READS
,vDeltaBUFFER_GETS
,vDeltaROWS_PROCESSED
,vDeltaCPU_TIME
,vDeltaELAPSED_TIME
)
;
tSQLSummary(v1.address||v1.hash_value).address:=v1.address;
tSQLSummary(v1.address||v1.hash_value).hash_value:=v1.hash_value;
tSQLSummary(v1.address||v1.hash_value).sorts:=vDeltaSorts;
tSQLSummary(v1.address||v1.hash_value).FETCHES:=vDeltaFETCHES;
tSQLSummary(v1.address||v1.hash_value).EXECUTIONS:=vDeltaEXECUTIONS;
tSQLSummary(v1.address||v1.hash_value).PARSE_CALLS:=vDeltaPARSE_CALLS;
tSQLSummary(v1.address||v1.hash_value).DISK_READS:=vDeltaDISK_READS;
tSQLSummary(v1.address||v1.hash_value).BUFFER_GETS:=vDeltaBUFFER_GETS;
tSQLSummary(v1.address||v1.hash_value).ROWS_PROCESSED:=vDeltaROWS_PROCESSED;
tSQLSummary(v1.address||v1.hash_value).CPU_TIME:=vDeltaCPU_TIME;
tSQLSummary(v1.address||v1.hash_value).ELAPSED_TIME:=vDeltaELAPSED_TIME;
vTotDeltaSorts:=vTotDeltaSorts+vDeltaSorts;
vTotDeltaFETCHES:=vTotDeltaFETCHES+vDeltaFETCHES;
vTotDeltaEXECUTIONS:=vTotDeltaEXECUTIONS+vDeltaEXECUTIONS;
vTotDeltaPARSE_CALLS:=vTotDeltaPARSE_CALLS+vDeltaPARSE_CALLS;
vTotDeltaDISK_READS:=vTotDeltaDISK_READS+vDeltaDISK_READS;
vTotDeltaBUFFER_GETS:=vTotDeltaBUFFER_GETS+vDeltaBUFFER_GETS;
vTotDeltaROWS_PROCESSED:=vTotDeltaROWS_PROCESSED+vDeltaROWS_PROCESSED;
vTotDeltaCPU_TIME:=vTotDeltaCPU_TIME+vDeltaCPU_TIME;
vTotDeltaELAPSED_TIME:=vTotDeltaELAPSED_TIME+vDeltaELAPSED_TIME;
insert into perfstat.perfext_sql_summary
(
SNAP_TIME
,SNAP_ID
,ADDRESS
,HASH_VALUE
,SORTS
,FETCHES
,EXECUTIONS
,PARSE_CALLS
,DISK_READS
,BUFFER_GETS
,ROWS_PROCESSED
,CPU_TIME
,ELAPSED_TIME
)
values
(
gSnapTime
,in_snap_id
,v1.ADDRESS
,v1.HASH_VALUE
,v1.SORTS
,v1.FETCHES
,v1.EXECUTIONS
,v1.PARSE_CALLS
,v1.DISK_READS
,v1.BUFFER_GETS
,v1.ROWS_PROCESSED
,v1.CPU_TIME
,v1.ELAPSED_TIME
)
;
end loop;
insert into perfstat.perfext_sql_summary_agg_delta
(
FROM_SNAP_TIME
,SNAP_ID
,TO_SNAP_TIME
,SORTS
,FETCHES
,EXECUTIONS
,PARSE_CALLS
,DISK_READS
,BUFFER_GETS
,ROWS_PROCESSED
,CPU_TIME
,ELAPSED_TIME
)
values
(
gPrevSnapTime
,in_snap_id
,gSnapTime
,vTotDeltaSORTS
,vTotDeltaFETCHES
,vTotDeltaEXECUTIONS
,vTotDeltaPARSE_CALLS
,vTotDeltaDISK_READS
,vTotDeltaBUFFER_GETS
,vTotDeltaROWS_PROCESSED
,vTotDeltaCPU_TIME
,vTotDeltaELAPSED_TIME
)
;
insert into perfstat.perfext_sql_summary_agg
(
SNAP_TIME
,SNAP_ID
,SORTS
,FETCHES
,EXECUTIONS
,PARSE_CALLS
,DISK_READS
,BUFFER_GETS
,ROWS_PROCESSED
,CPU_TIME
,ELAPSED_TIME
)
values
(
gSnapTime
,in_snap_id
,vSORTS
,vFETCHES
,vEXECUTIONS
,vPARSE_CALLS
,vDISK_READS
,vBUFFER_GETS
,vROWS_PROCESSED
,vCPU_TIME
,vELAPSED_TIME
)
;
insert into perfstat.perfext_sql_summary_aggpe
(
SNAP_TIME
,SNAP_ID
,TOT_SORTS_PER_EXEC
,TOT_FETCHES_PER_EXEC
,TOT_PARSE_CALLS_PER_EXEC
,TOT_DISK_READS_PER_EXEC
,TOT_BUFFER_GETS_PER_EXEC
,TOT_ROWS_PROCESSED_PER_EXEC
,TOT_CPU_TIME_PER_EXEC
,TOT_ELAPSED_TIME_PER_EXEC
,REC_COUNT
)
values
(
gSNAPTIME
,in_SNAP_ID
,vTOT_SORTS_PER_EXEC
,vTOT_FETCHES_PER_EXEC
,vTOT_PARSE_CALLS_PER_EXEC
,vTOT_DISK_READS_PER_EXEC
,vTOT_BUFFER_GETS_PER_EXEC
,vTOT_ROWS_PROCESSED_PER_EXEC
,vTOT_CPU_TIME_PER_EXEC
,vTOT_ELAPSED_TIME_PER_EXEC
,vRows
)
;
—
—
—
–HIT LIST–
vKey:=tSQLSummary.first;
while tSQLSummary.exists(vKey)
loop
if tSQLSummary(vKey).executions>0
then
if tSQLSummary(vKey).buffer_gets>=(vTotDeltabuffer_gets*.01)
or tSQLSummary(vKey).cpu_time>=(vTotDeltacpu_time*.1)
or tSQLSummary(vKey).elapsed_time>=(vTotDeltaelapsed_time*.1)
or (tSQLSummary(vKey).buffer_gets/tSQLSummary(vKey).executions)=(vtot_buffer_ge
ts_per_exec*.01)
or (tSQLSummary(vKey).cpu_time/tSQLSummary(vKey).executions)=(vtot_cpu_time_per
_exec*.1)
or (tSQLSummary(vKey).elapsed_time/tSQLSummary(vKey).executions)=(vtot_elapsed_
time_per_exec*.1)
then
vSQLText:=get_sqltext(tSQLSummary(vKey).address,tSQLSummary(vKey).hash_value
,2000);
–vScore:=vScore*tSQLSummary(vKey).buffer_gets*tSQLSummary(vKey).cpu_time*tS
QLSummary(vKey).elapsed_time;
–vScore:=tSQLSummary(vKey).buffer_gets*tSQLSummary(vKey).cpu_time*tSQLSumma
ry(vKey).elapsed_time*tSQLSummary(vKey).executions;
vScore:=
(100*round((tSQLSummary(vKey).buffer_gets/tSQLSummary(vKey).executions)/(vto
t_buffer_gets_per_exec),2))
+(100*round((tSQLSummary(vKey).cpu_time/tSQLSummary(vKey).executions)/(v
+tot_
cpu_time_per_exec),2))
+(100*round((tSQLSummary(vKey).elapsed_time/tSQLSummary(vKey).executions
+)/(v
tot_elapsed_time_per_exec),2))
+(100*round(tSQLSummary(vKey).buffer_gets/vTotDeltabuffer_gets,2))
+(100*round(tSQLSummary(vKey).cpu_time/vTotDeltacpu_time,2))
+(100*round(tSQLSummary(vKey).elapsed_time/vTotDeltaelapsed_time,2))
;
insert into perfstat.perfext_sql_hitlist
(
FROM_SNAP_TIME
,SNAP_ID
,TO_SNAP_TIME
,ADDRESS
,HASH_VALUE
,SORTS
,FETCHES
,EXECUTIONS
,PARSE_CALLS
,DISK_READS
,BUFFER_GETS
,ROWS_PROCESSED
,CPU_TIME
,ELAPSED_TIME
,SQL_TEXT
,GPE
,CPE
,EPE
,GPE_PCT
,CPE_PCT
,EPE_PCT
,G_PCT
,C_PCT
,E_PCT
,SCORE
)
values
(
gPrevSnapTime
,in_snap_id
,gSnapTime
,tSQLSummary(vKey).ADDRESS
,tSQLSummary(vKey).HASH_VALUE
,tSQLSummary(vKey).SORTS
,tSQLSummary(vKey).FETCHES
,tSQLSummary(vKey).EXECUTIONS
,tSQLSummary(vKey).PARSE_CALLS
,tSQLSummary(vKey).DISK_READS
,tSQLSummary(vKey).BUFFER_GETS
,tSQLSummary(vKey).ROWS_PROCESSED
,tSQLSummary(vKey).CPU_TIME
,tSQLSummary(vKey).ELAPSED_TIME
,vSQLText
,round((tSQLSummary(vKey).buffer_gets/tSQLSummary(vKey).executions),0)
,round((tSQLSummary(vKey).cpu_time/tSQLSummary(vKey).executions),0)
,round((tSQLSummary(vKey).elapsed_time/tSQLSummary(vKey).executions),0)
,100*round((tSQLSummary(vKey).buffer_gets/tSQLSummary(vKey).executions)/(vto
t_buffer_gets_per_exec),2)
,100*round((tSQLSummary(vKey).cpu_time/tSQLSummary(vKey).executions)/(vtot_c
pu_time_per_exec),2)
,100*round((tSQLSummary(vKey).elapsed_time/tSQLSummary(vKey).executions)/(vt
ot_elapsed_time_per_exec),2)
,100*round(tSQLSummary(vKey).buffer_gets/vTotDeltabuffer_gets,2)
,100*round(tSQLSummary(vKey).cpu_time/vTotDeltacpu_time,2)
,100*round(tSQLSummary(vKey).elapsed_time/vTotDeltaelapsed_time,2)
,vSCORE
)
;
end if;
end if;
vKey:=tSQLSummary.next(vKey);
end loop;
if gDebug then dbms_output.put_line(‘……SQL rows: ‘||vRows); end if; end;
——————————————————————–
function perfext_data_exists(in_snap_id number) return boolean is cursor c1 is
select ‘x’
from perfstat.perfext_sql_summary
where 1=1
and snap_id=in_snap_id
and rownum=1
;
bReturn boolean;
begin
if gFakeNoData then return false; end if;
bReturn:=false;
for v1 in c1
loop
bReturn:=true;
end loop;
return bReturn;
end;
——————————————————————–
end;
/
